Table of Contents
Comparison of spectral upsampling methods
I took the dataset published alongside Otsu et. al (2018) and colorcheckers included in Colour, about 1300 reflectance spectra in total, reconstructed them using various methods and compared them with the original data. I used CIE Standard Illuminant D65 and two metrics:
- CIE 1976 ΔE1), quantizing the perceived difference between two colors. Values around 2.4 are taken as the just-noticeable difference, so deltas smaller than this should be insignificant.
- Mean squared error (MSE), the mean squared difference between the original and reconstructed spectra. For any reflectance, there infinitely many metamers, other reflectances that look exactly the same (ΔE=0) under a given illuminant. Good spectral upsampling should result in realistic spectra, i.e. those that look similar to those of common and natural materials. This helps spectral rendering to achieve natural results as well. See Peters et al. (2019) for an interesting and more in-depth discussion of the topic.
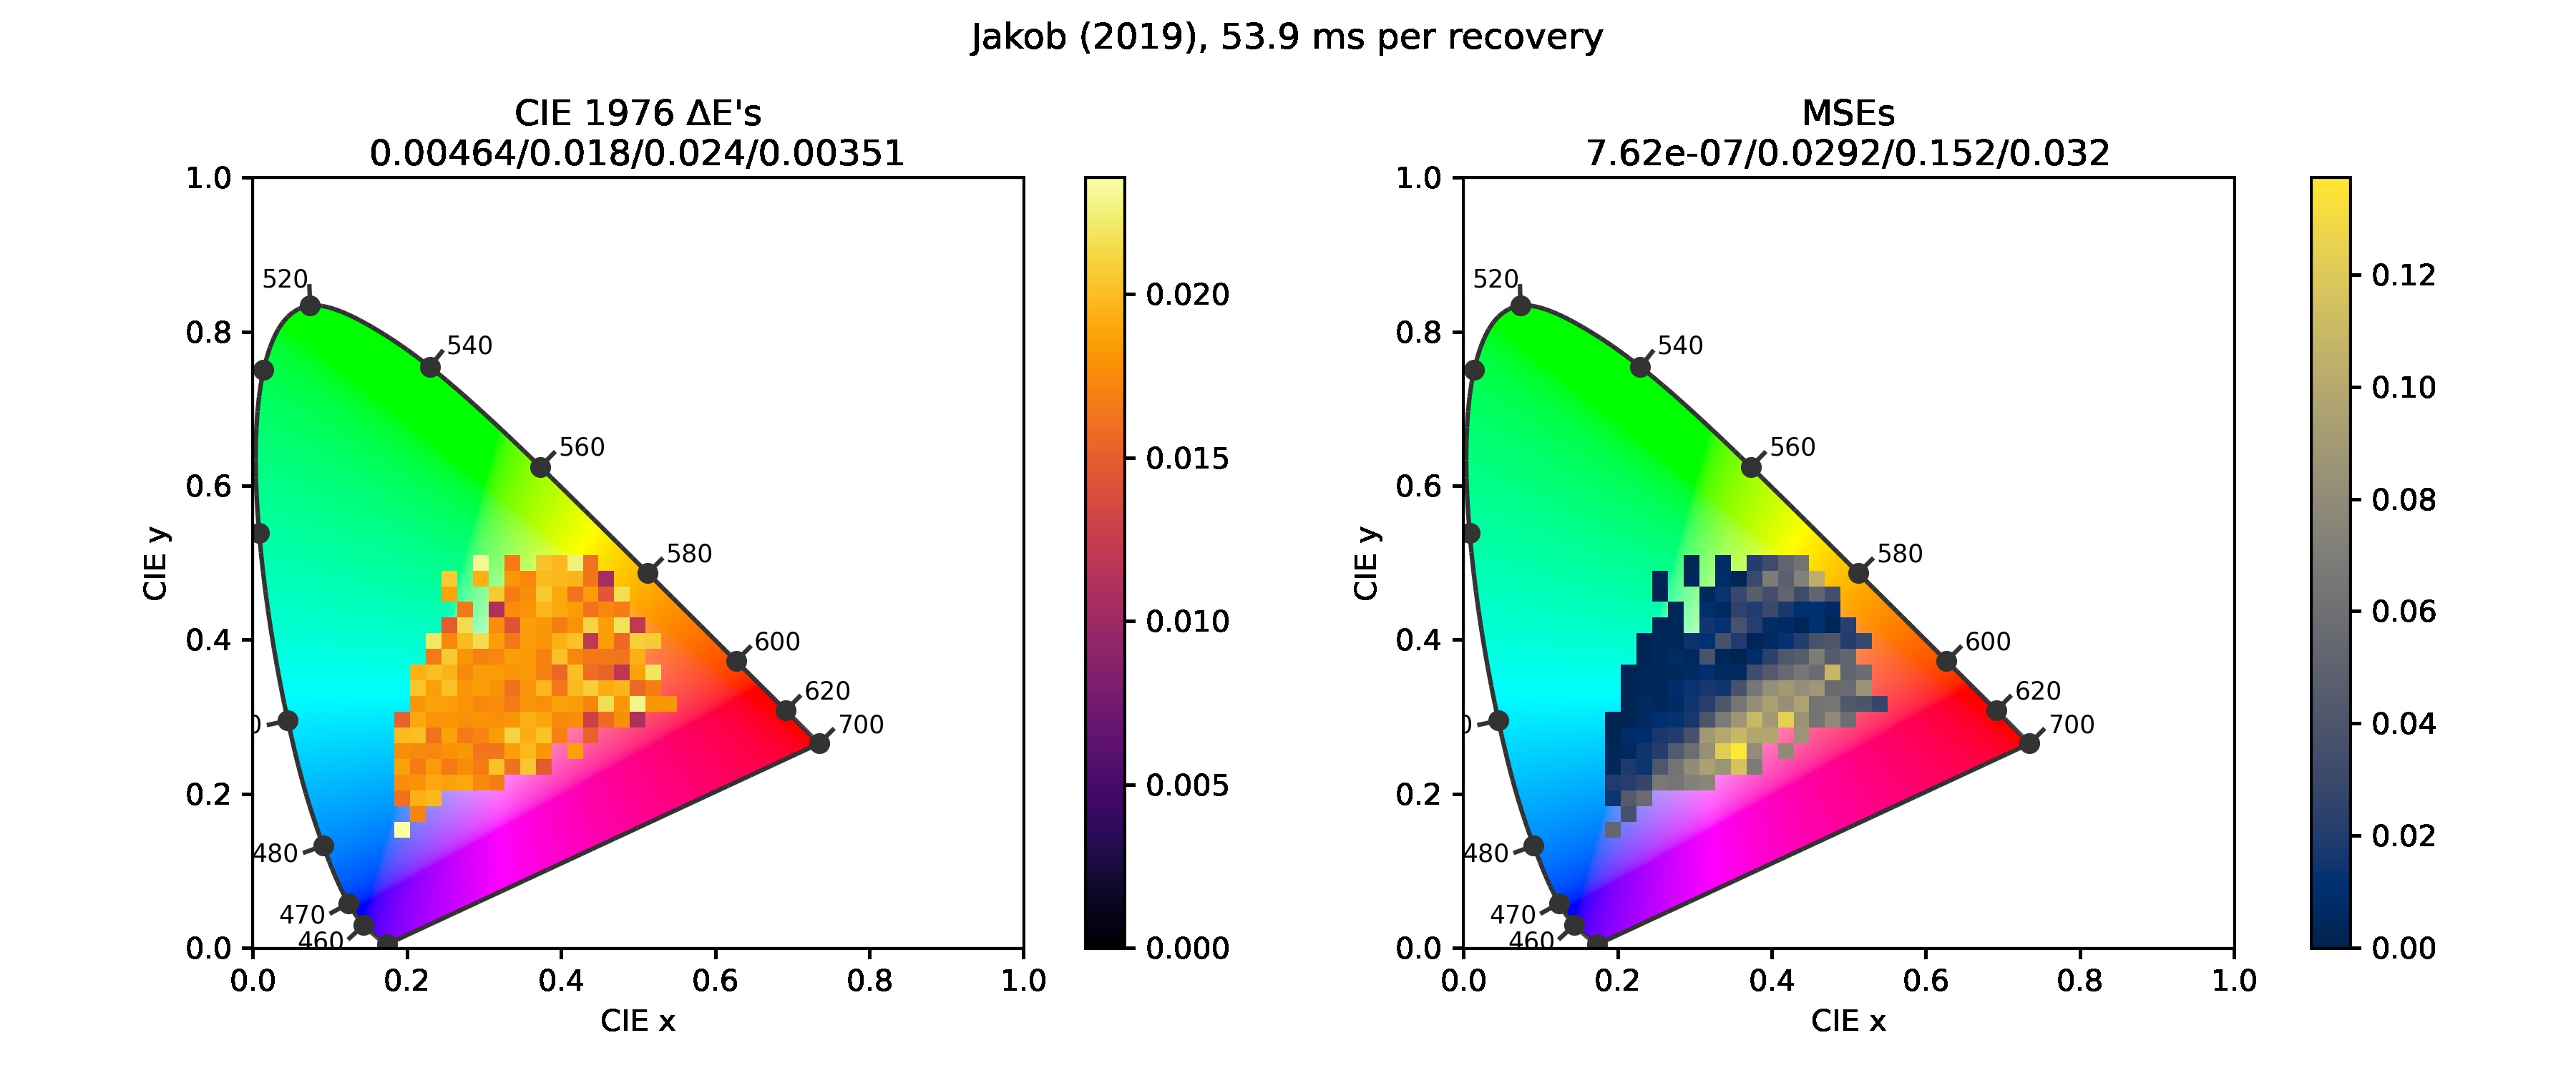
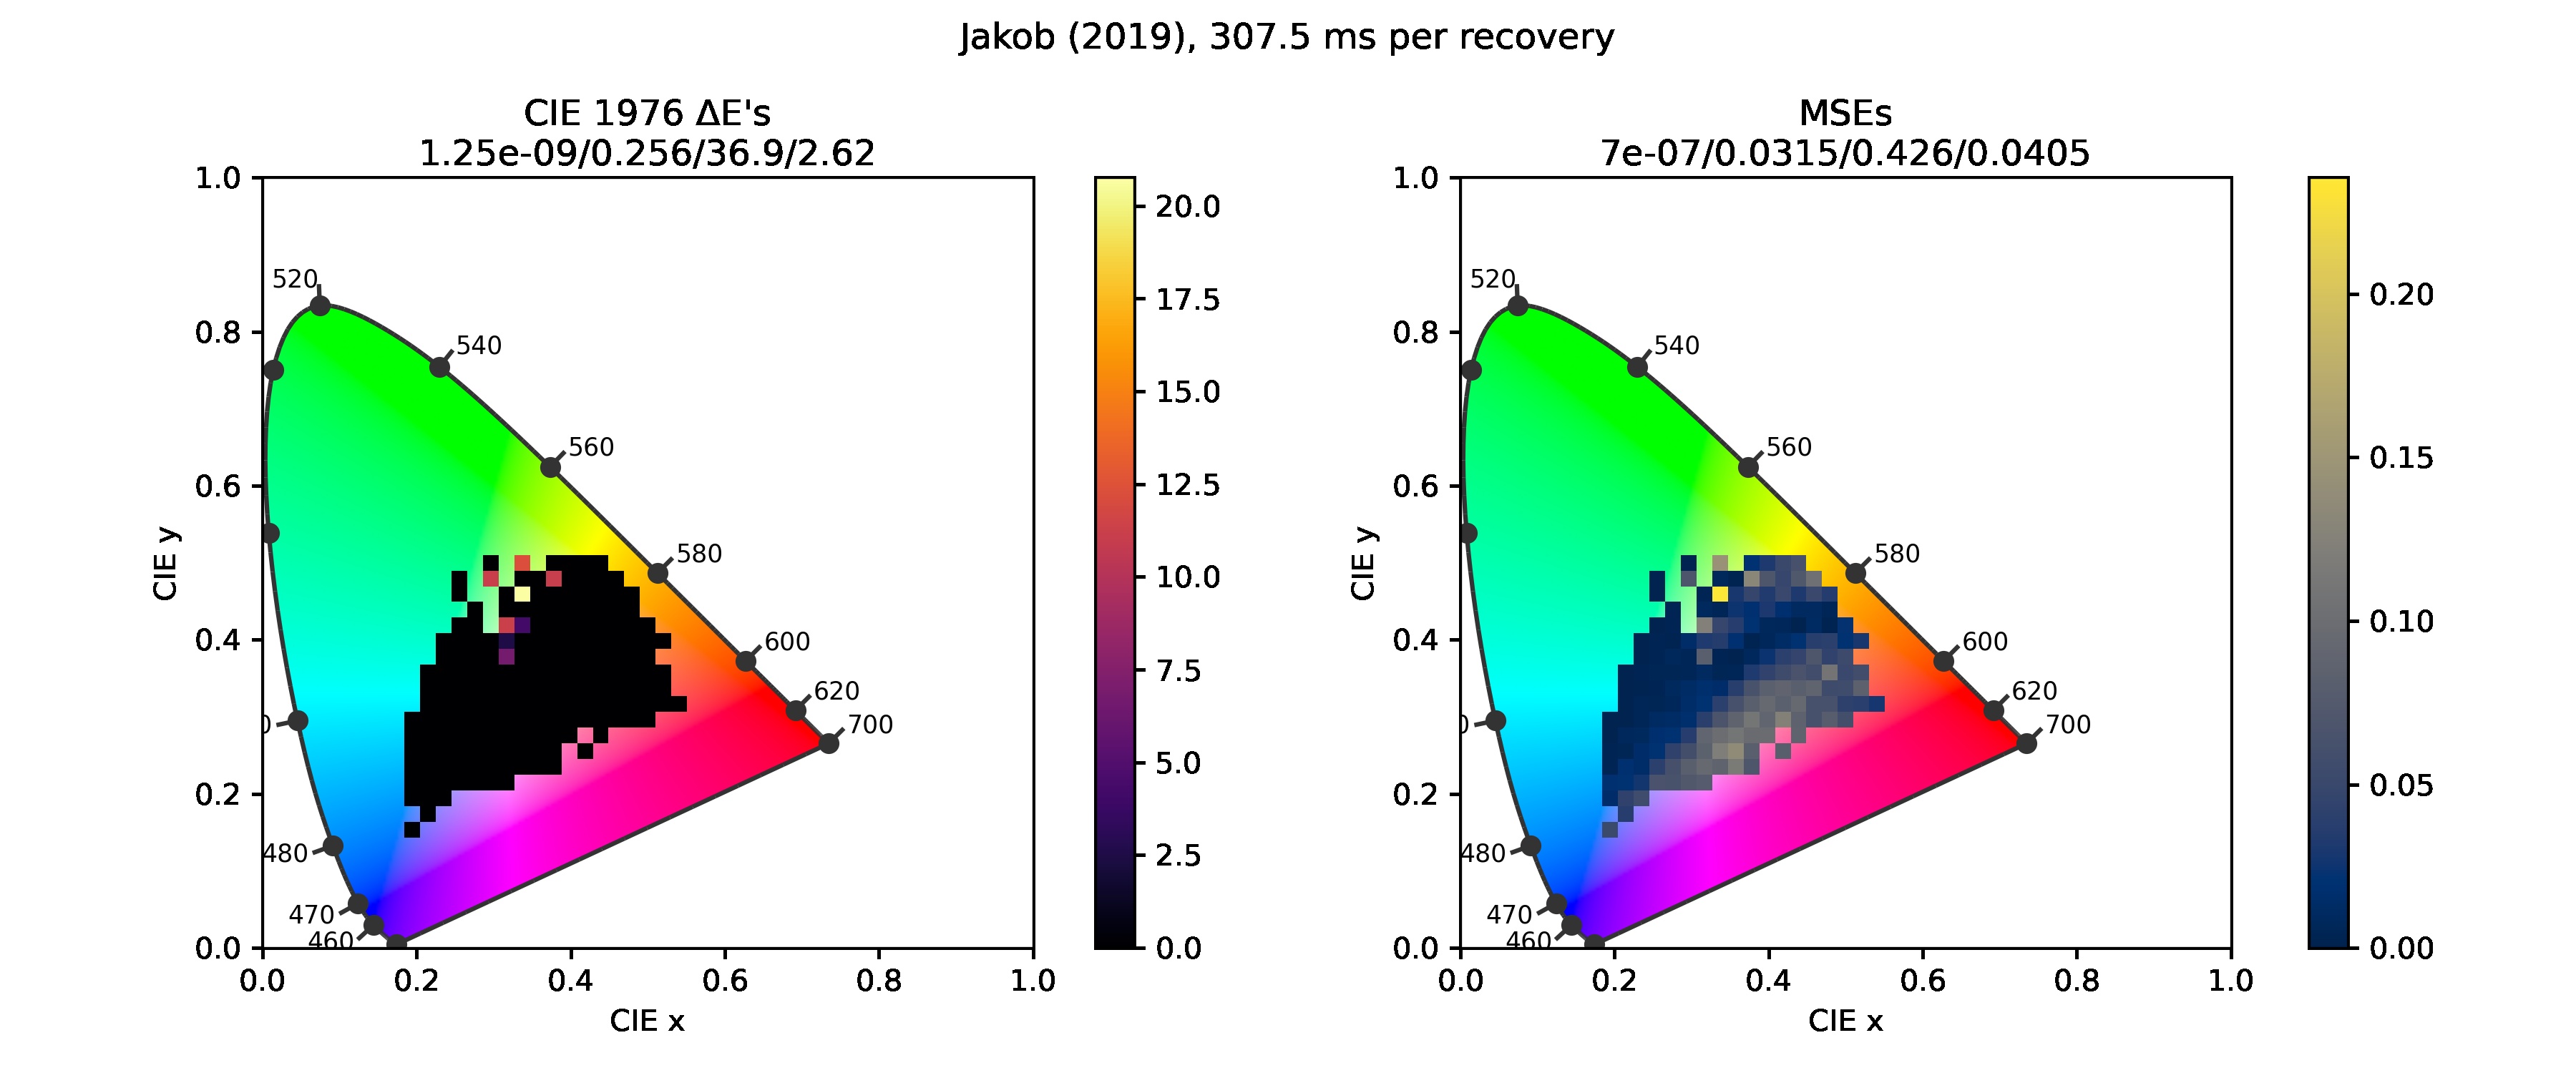
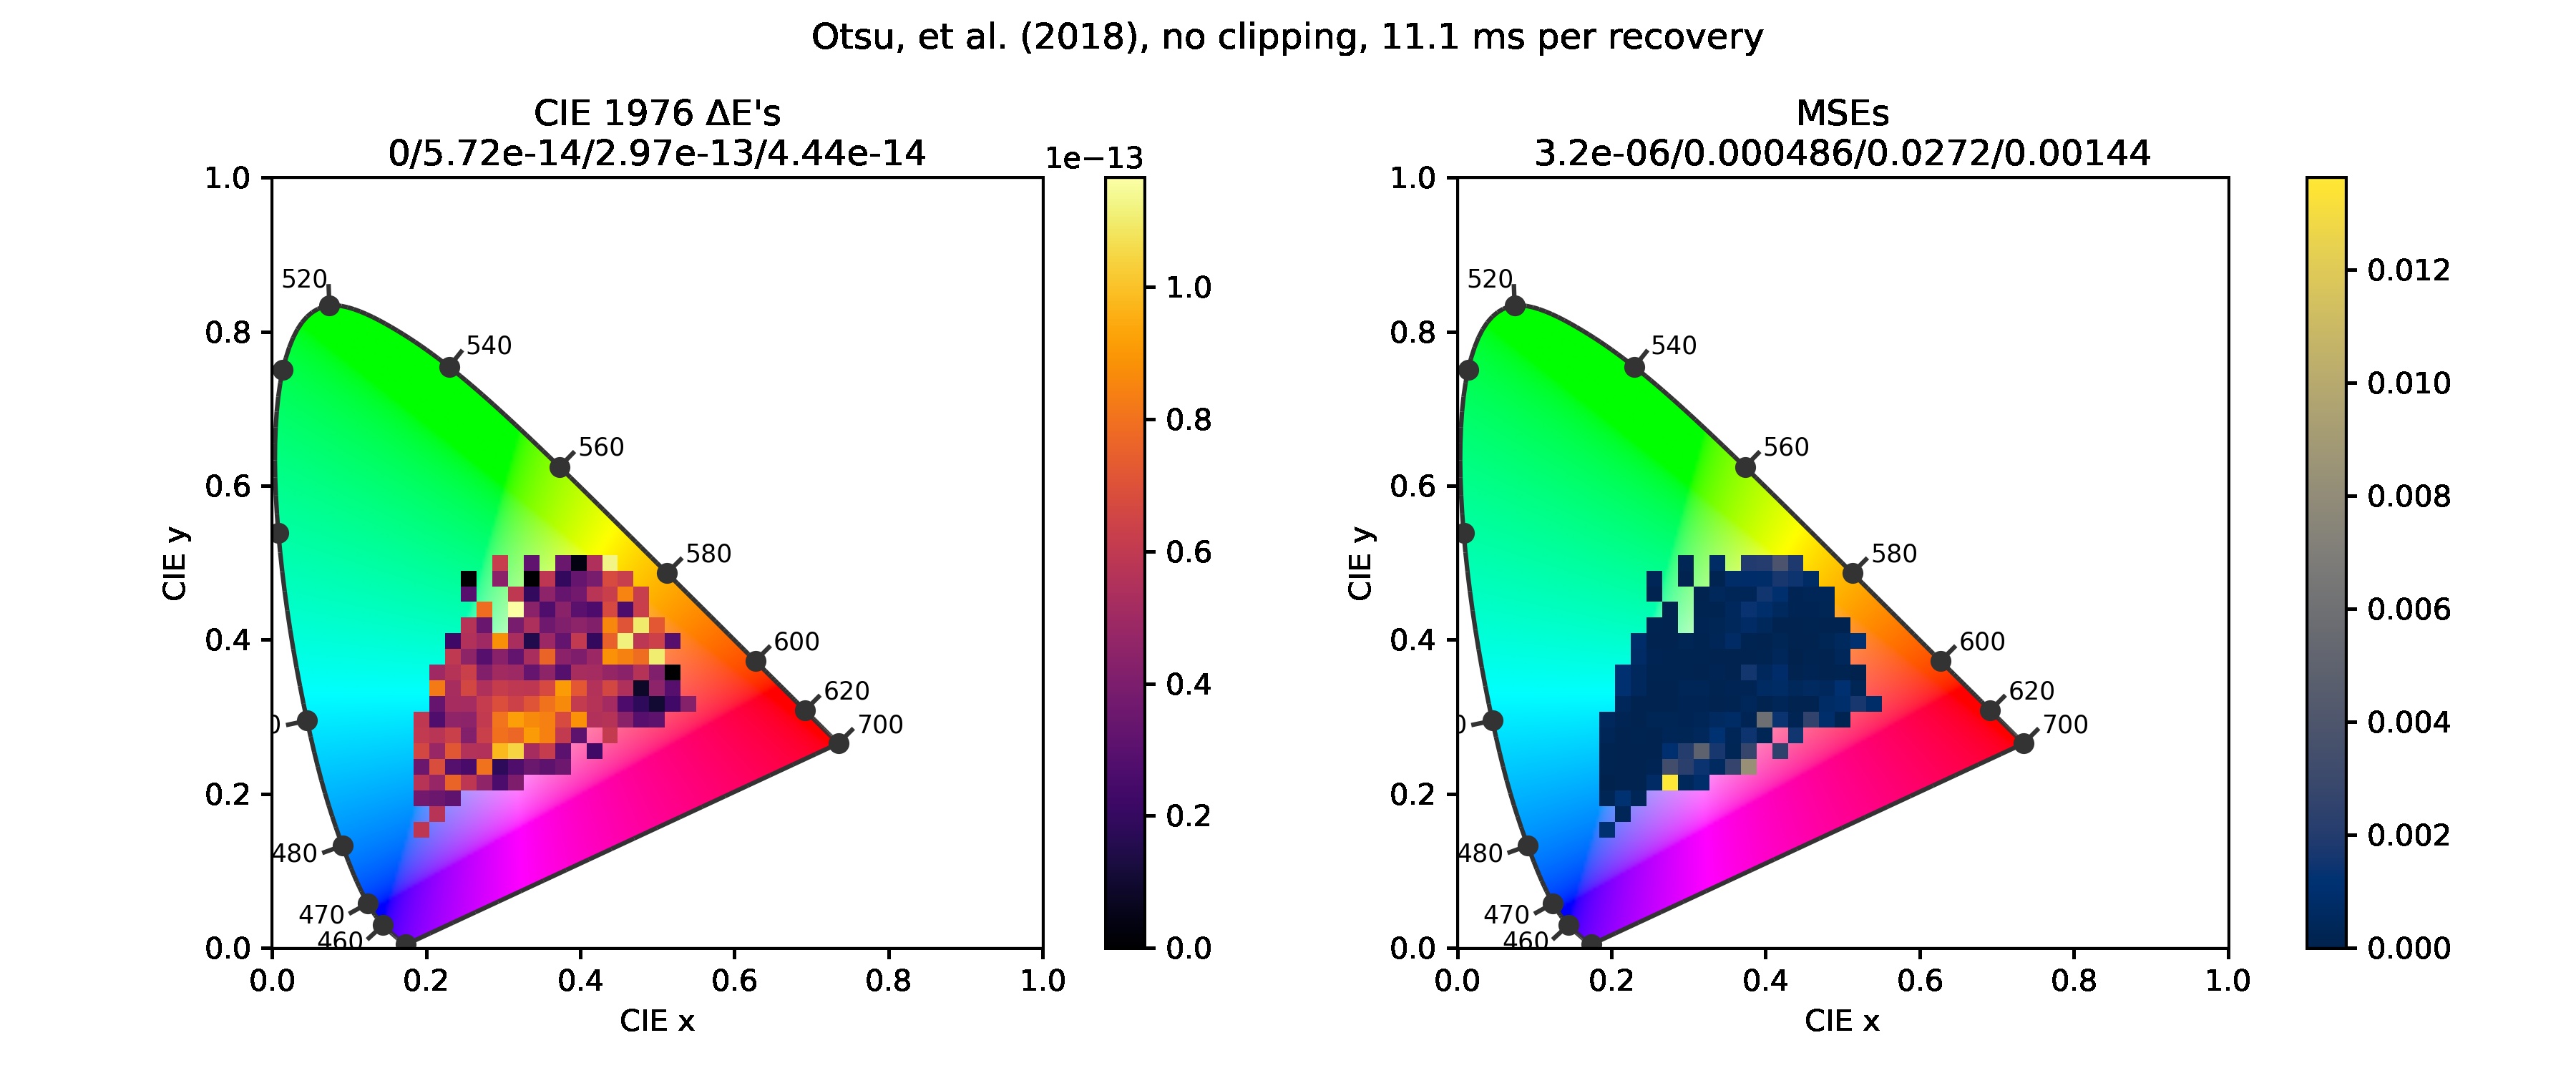
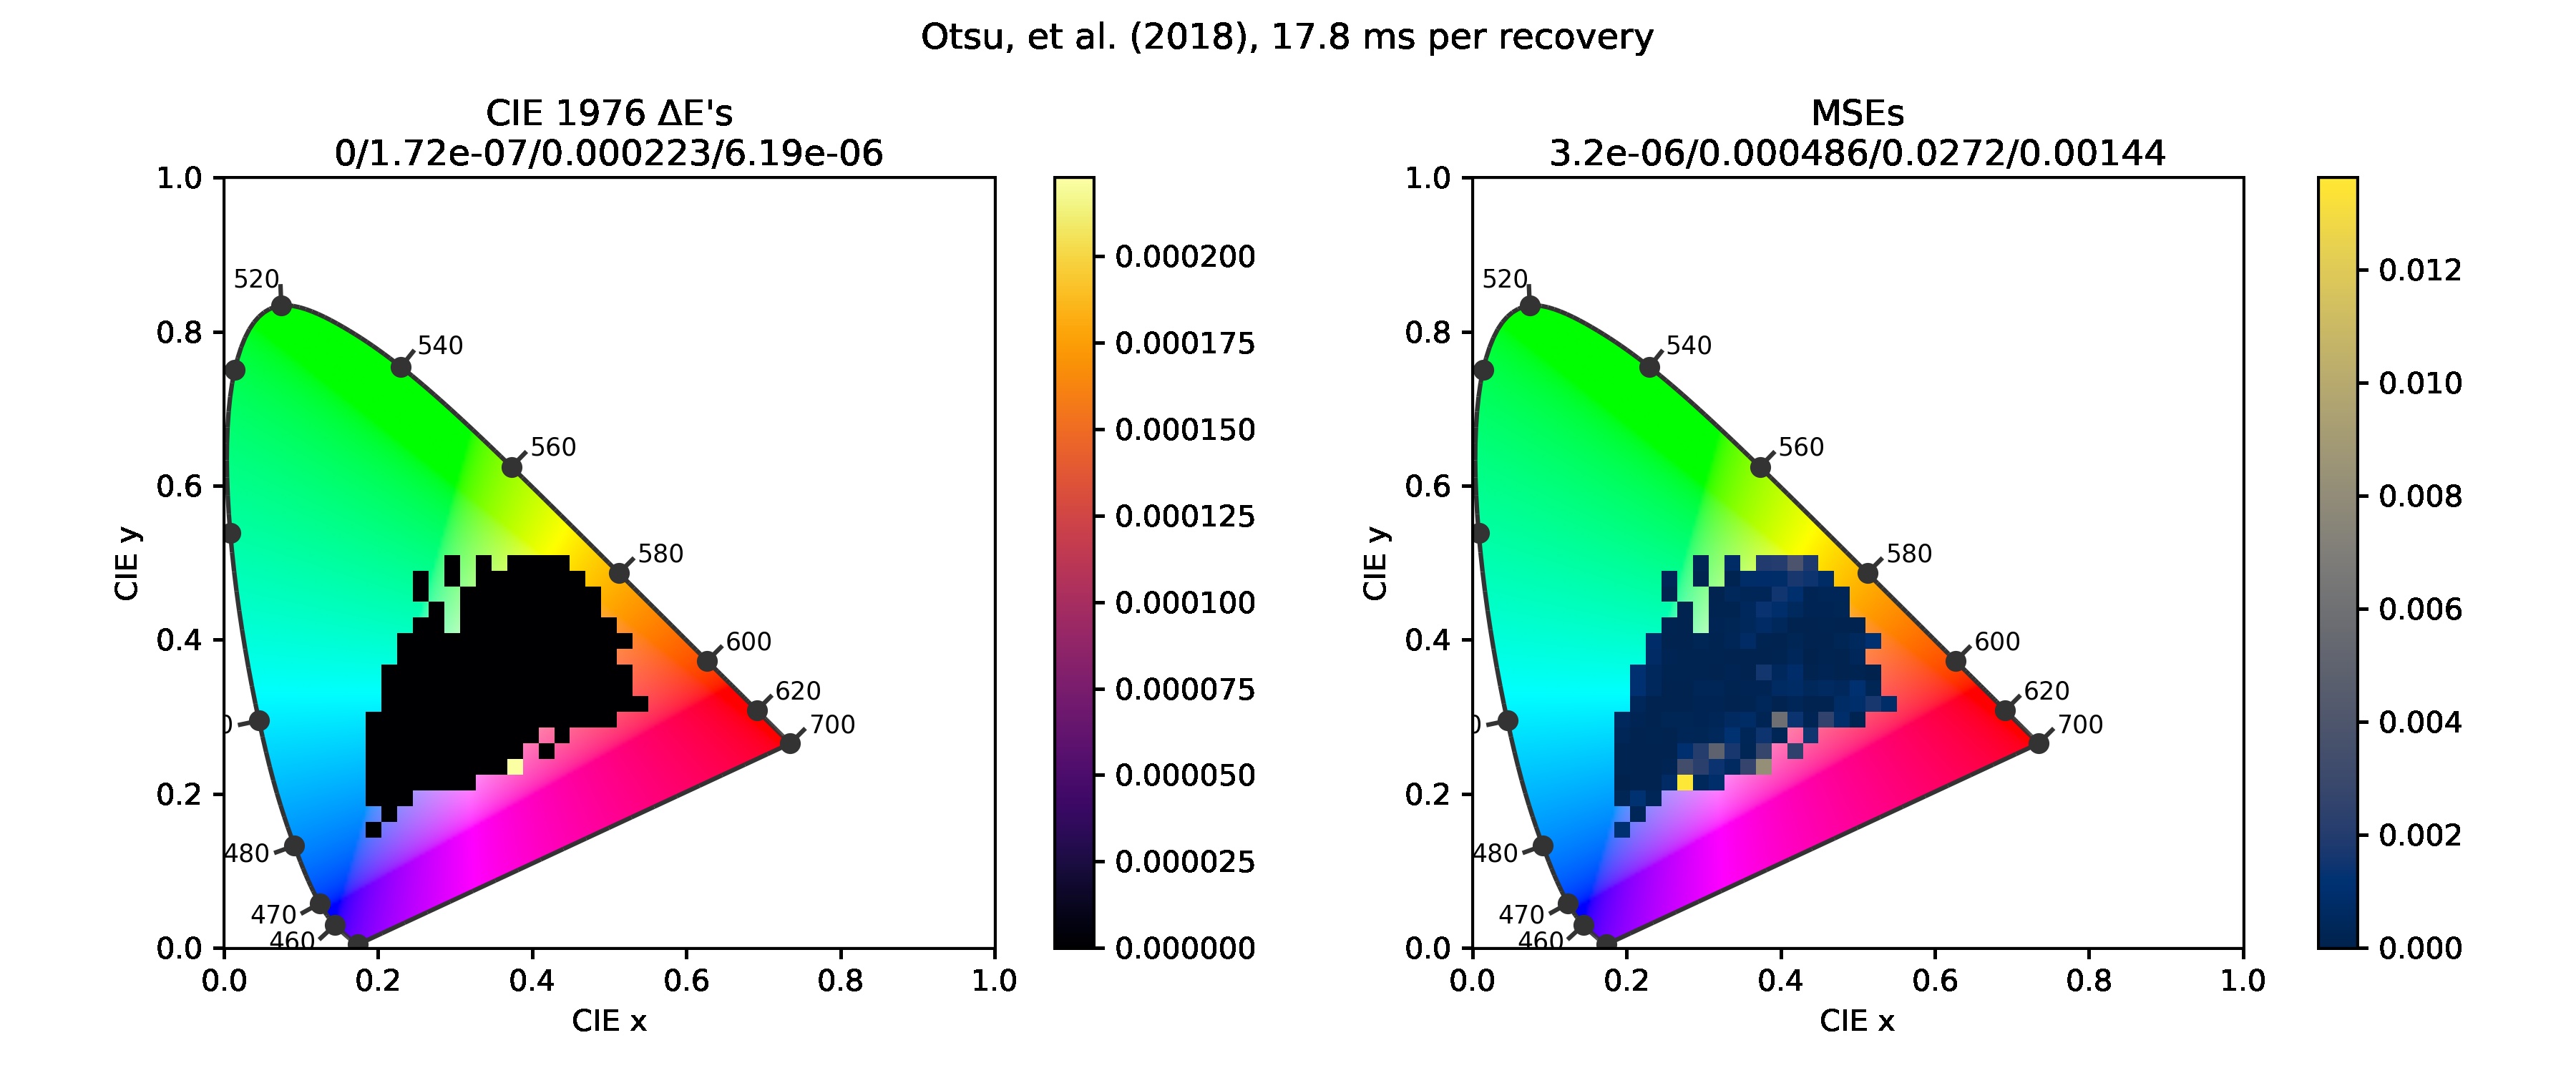
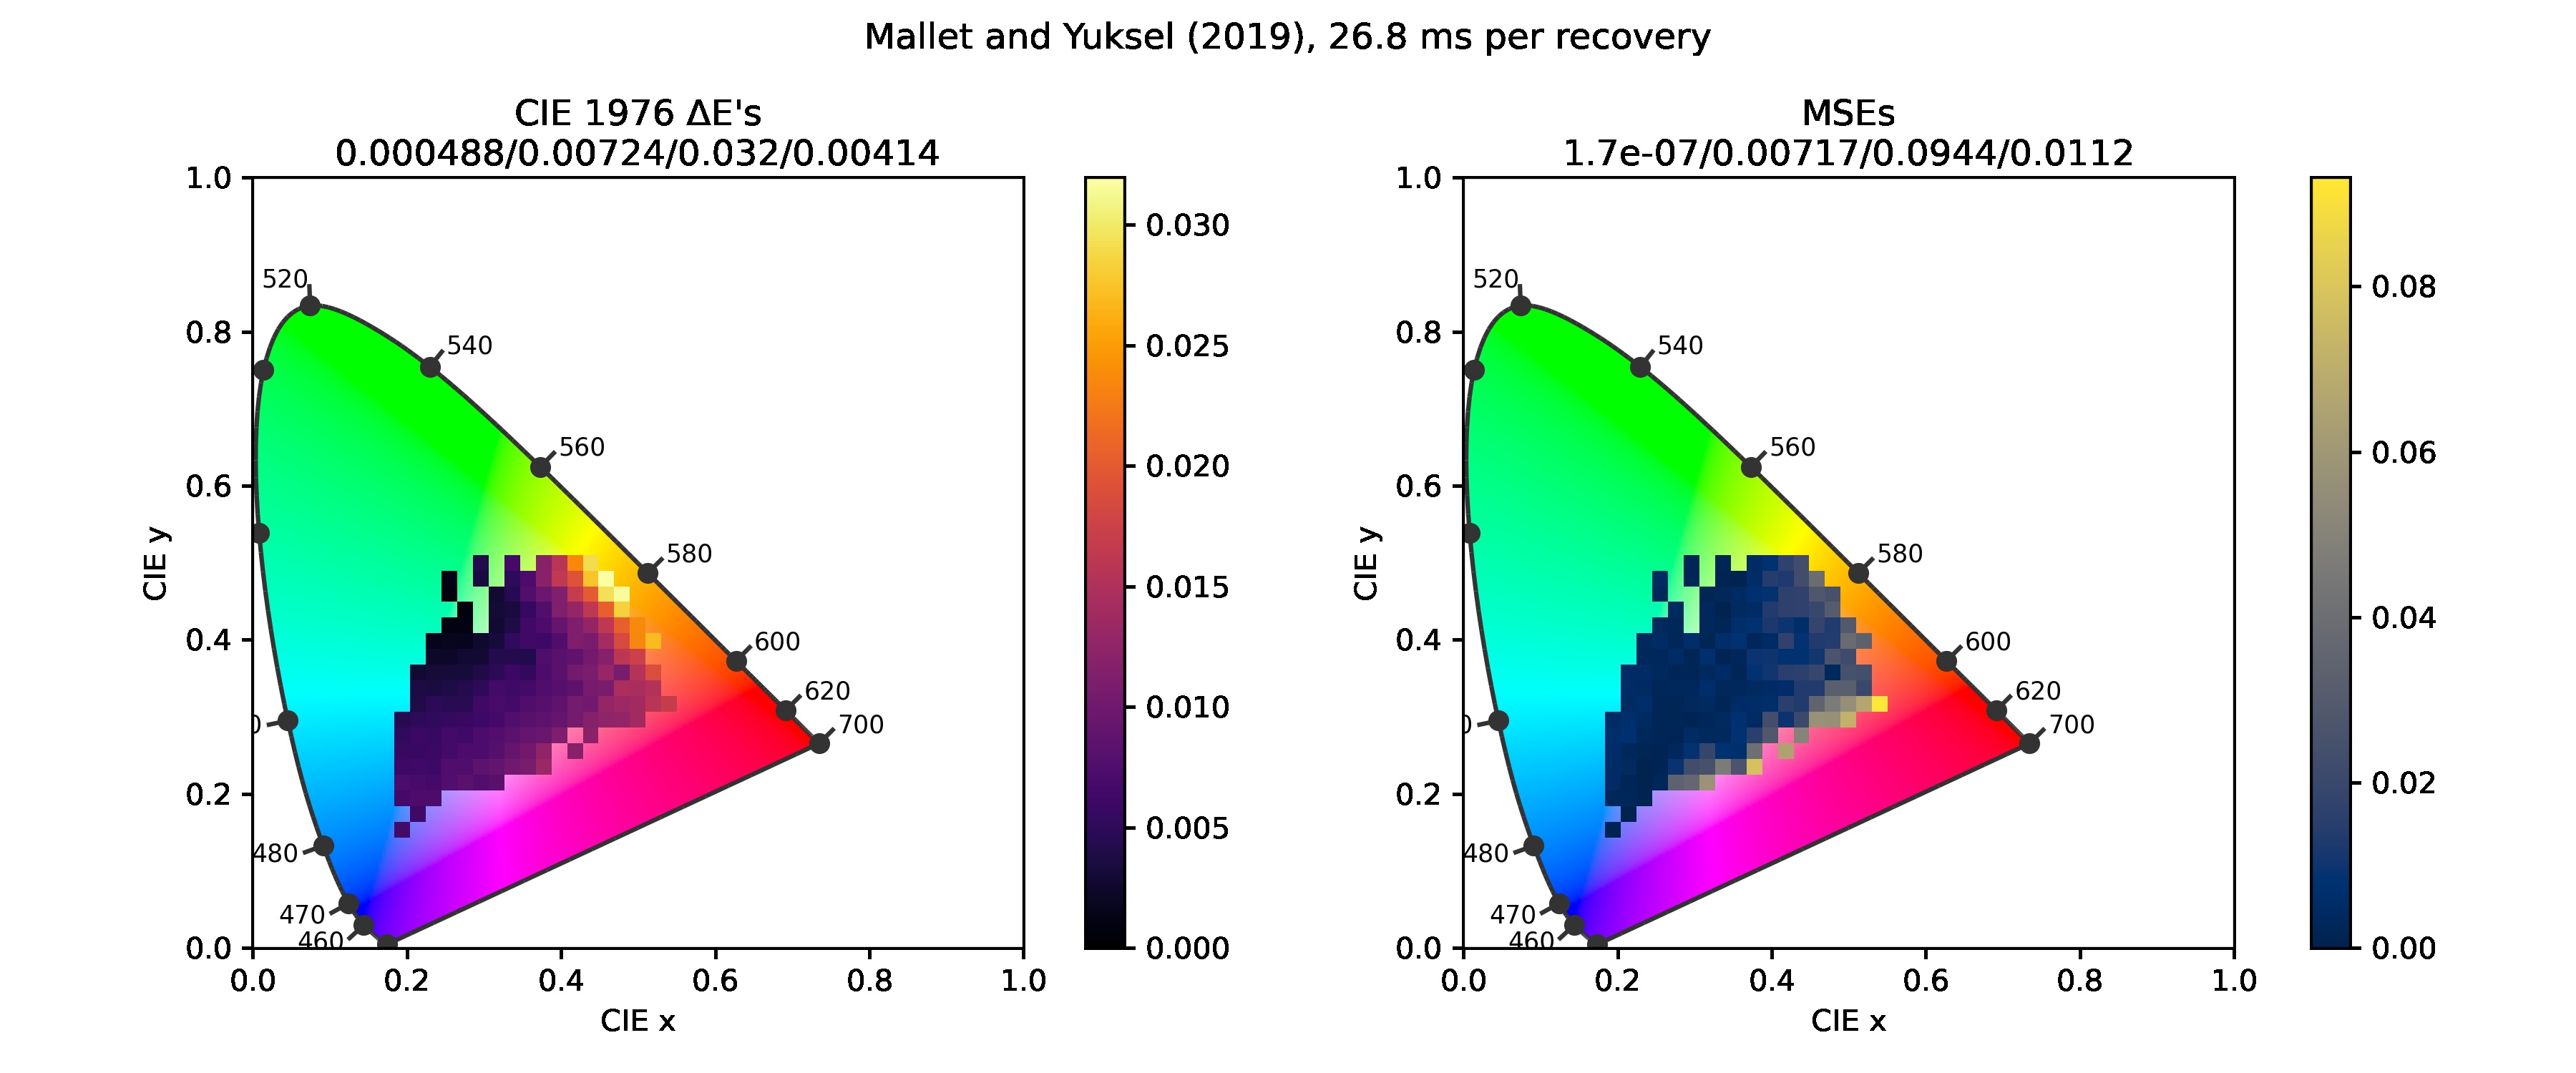
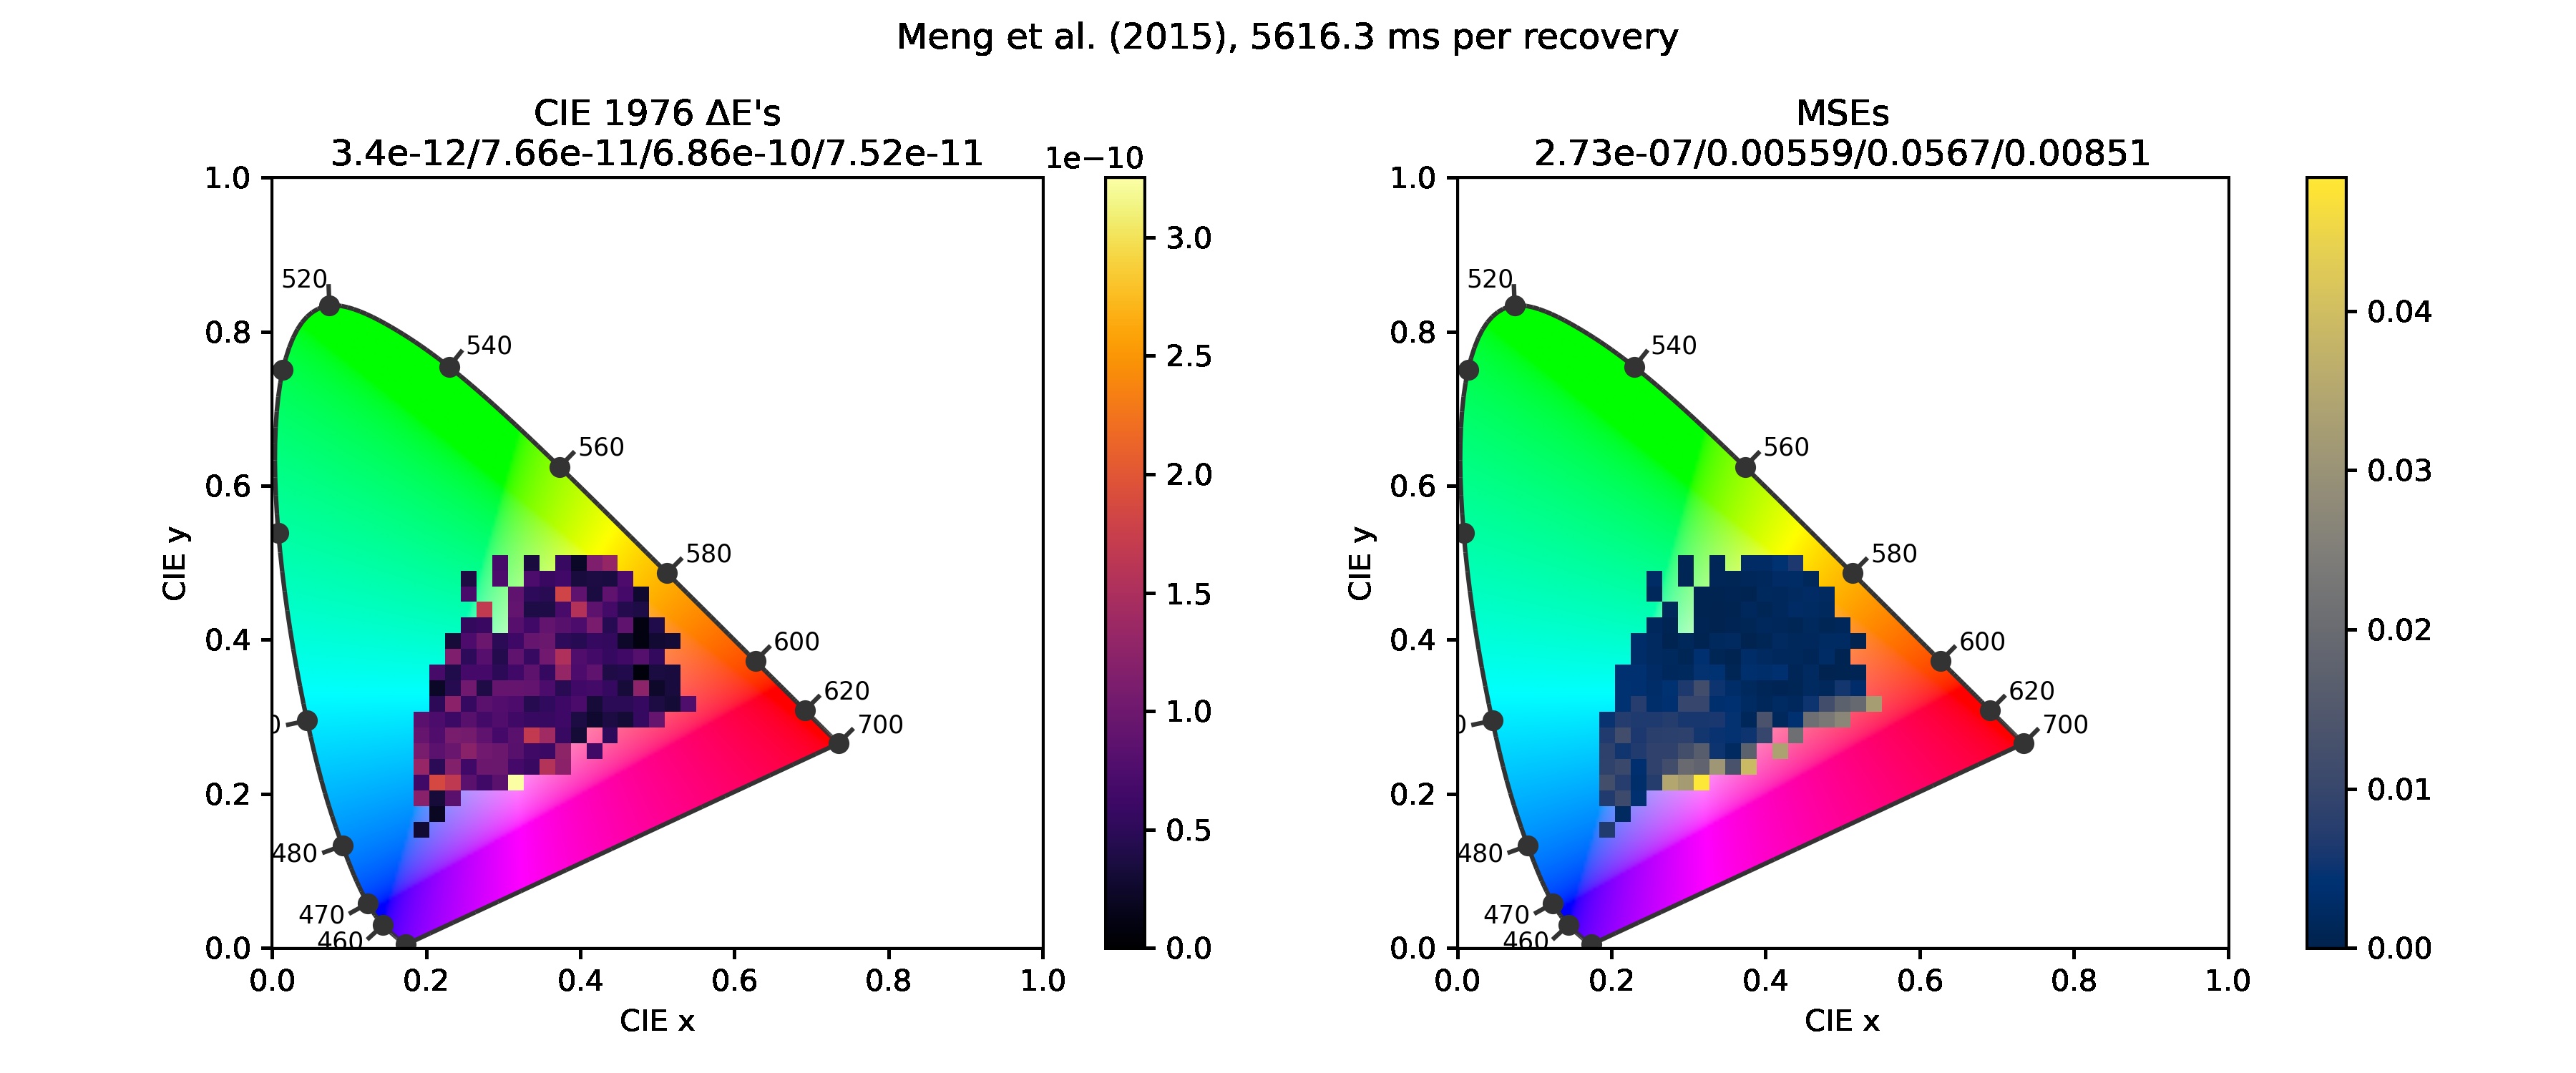
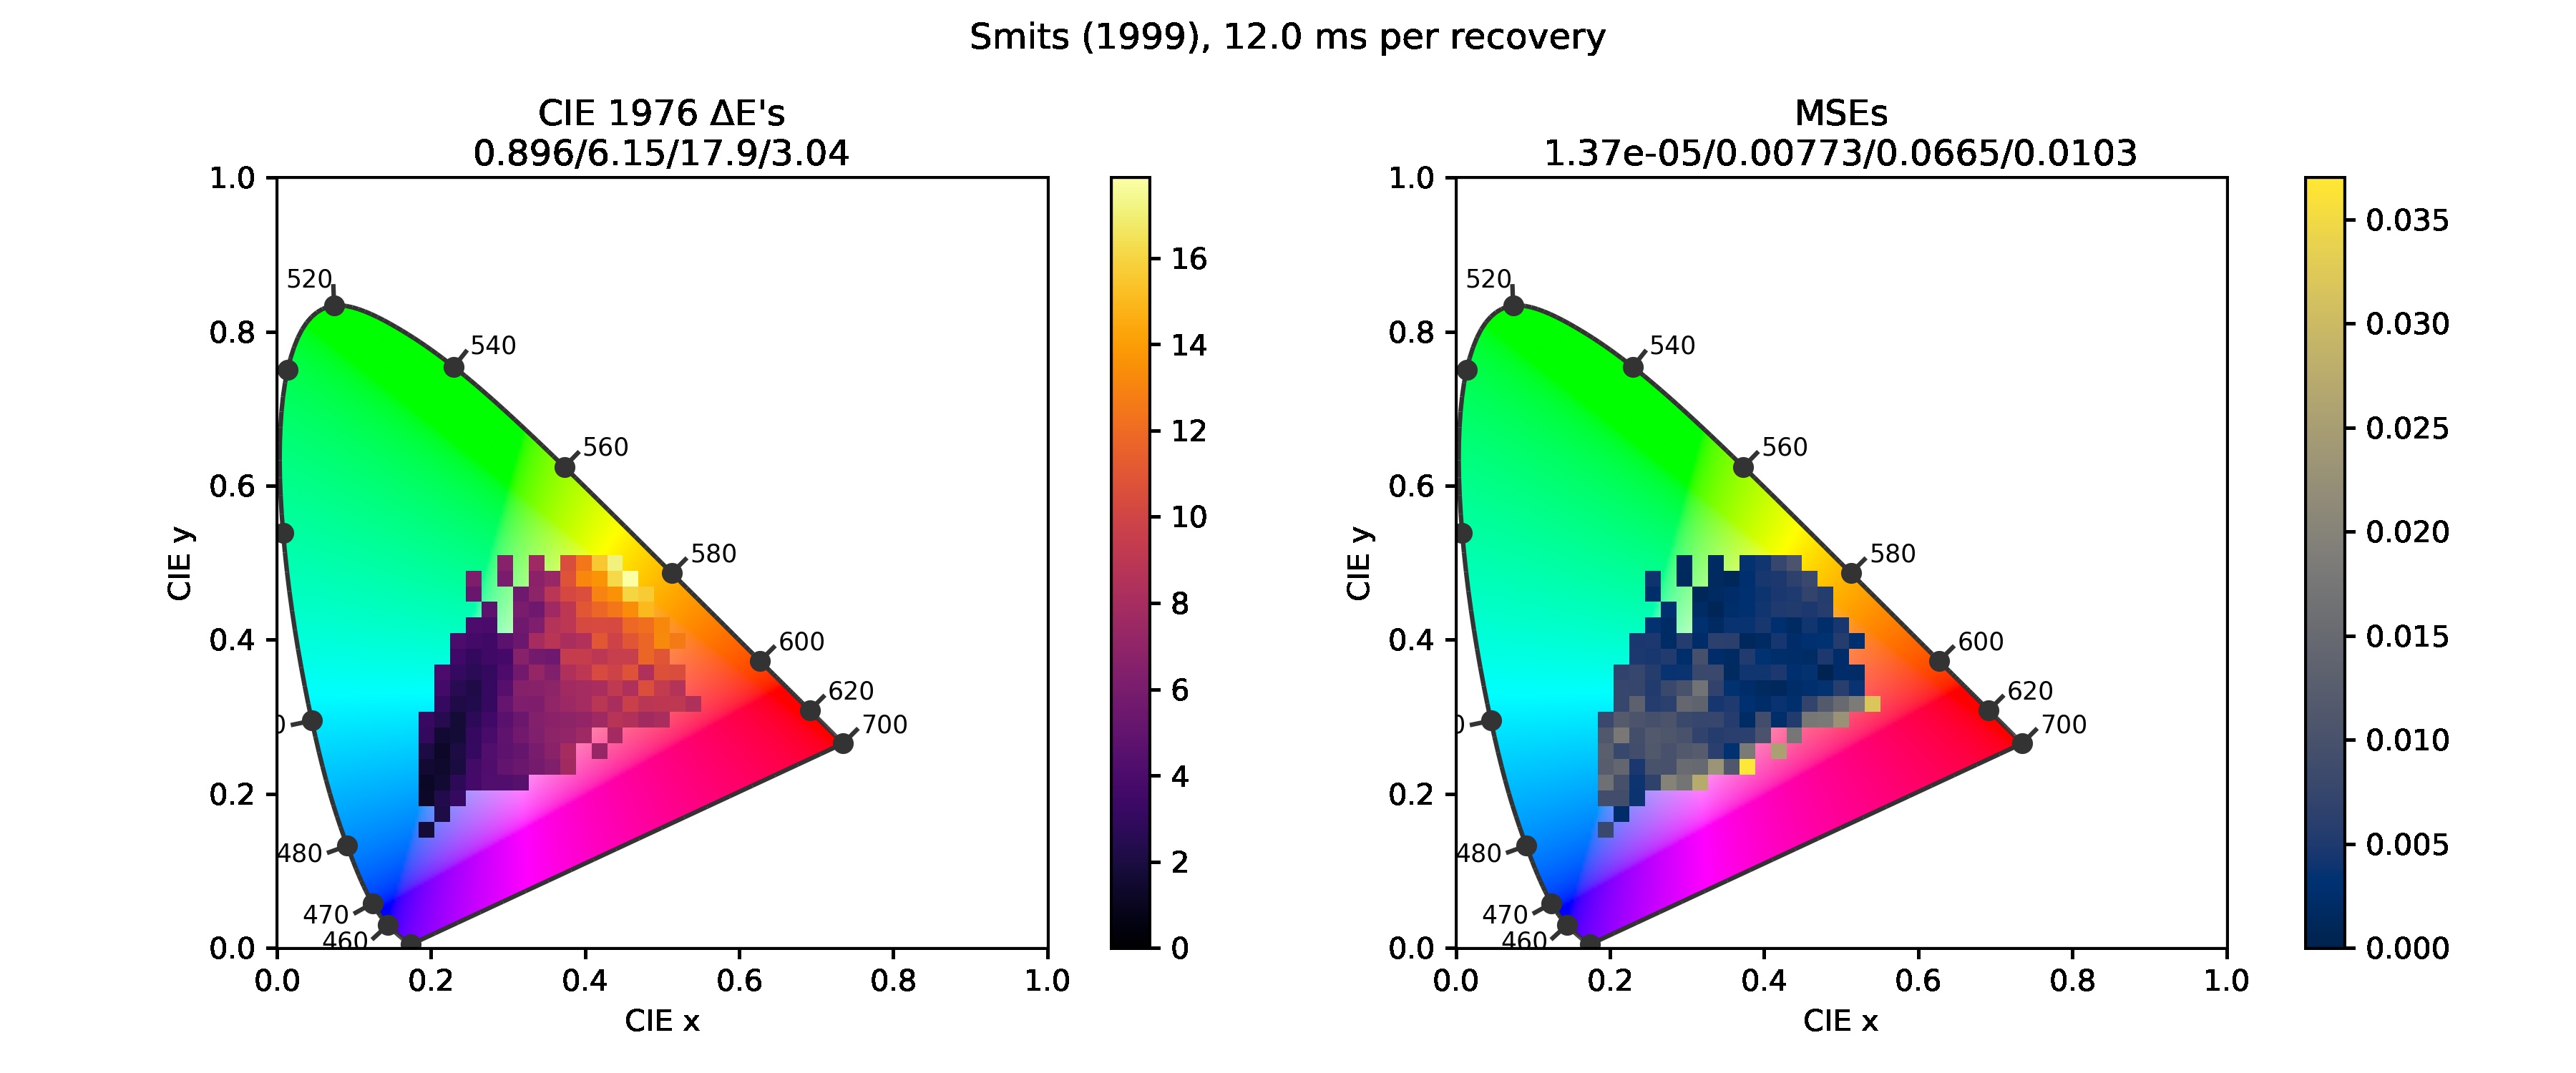
Below are chromaticity diagrams with error heatmaps drawn over them. The color of each square bin represents the mean error of samples lying inside the square. The numbers above the diagrams are, in order, the minimum, maximum, mean and standard deviation of the errors.
Jakob and Hanika (2019)
Ending optimization as soon as the error falls below 0.024 results in a roughly uniform distribution, bounded above by the number. The process is also relatively quick.
Letting SciPy's L-BFGS-B solver decide on its own when to stop actually makes it diverge at many points. I'll have to revisit the code and fix this issue.
Otsu et al. (2018)
The picture above shows that the method has no round-trip errors, ie. the recovered spectra are exact metamers (have the exact same color).
Clipping unphysical reflectances caused a very small color shift at a single point. It's the sample I talked about in detail in a previous post.
Mallett and Yuksel (2019)
Mallett and Yuksel (2019) is a method I implemented very recently and I haven't posted about it. More details will follow in a future update.
Meng et al. (2015), Smits (1999)
These two methods had already been implemented in Colour Smits (1999) is a relatively simple method, assembling a matching reflectance using pre-defined bases. Meng et al. (2015) is a method similar to Jakob and Hanika (2019) in that it numerically solves an optimization problem to reconstruct a spectrum.
Errors in Smits (1999) look like the result of an illuminant mismatch. I'll have to redo that. Producing the data for the graph for Meng et al. (2015) took me about 2 hours, so it's another thing to take a closer look at.
Summary
Since all methods (bugs and user errors aside) have negligible ΔE's, I'll summarize their MSEs in the table below. Mean MSEs are compared to the method with the lowest mean error.
{|
! Method ! colspan=“2” | Mean ! Max ! Std. dev.
Unsurprisingly, the data-driven method produces results that look like data the most. Jakob and Hanika's equation seems model much more artificial reflectances.

